Financial Performance
2022 Results
Travelers generated very strong core income of $3.0 billion, or $12.42 of core income per diluted share, producing an industry-leading core return on equity of 11.3%, a meaningful spread above both the 10-year Treasury and our cost of equity.
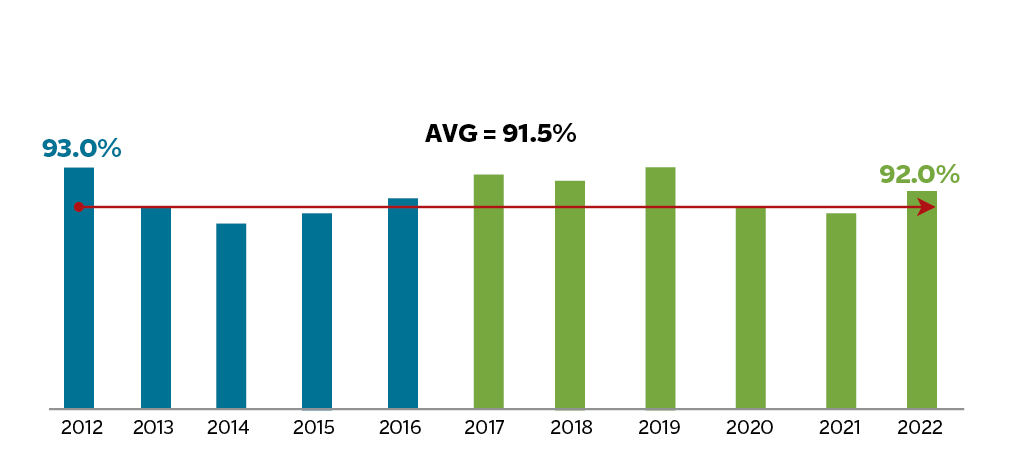
We again delivered very strong underlying underwriting income of $2.1 billion after-tax, driven by record net earned premiums and an underlying combined ratio of 92.0%. Despite the challenging environment, 2022 was the third year in a row that underlying underwriting income has exceeded $2.0 billion. Through higher business volumes and continued strong profitability, we have driven underlying underwriting income to a new, higher level and sustained it there. This result reflects the success we have had executing on our innovation strategy, and demonstrates both the quality of our underwriting and the discipline with which we run our business.
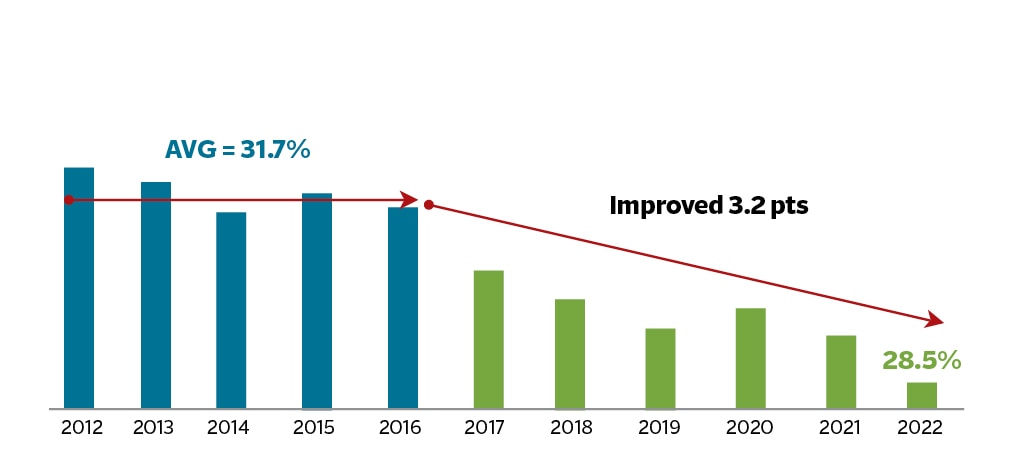
We also improved our expense ratio to a record-low 28.5% during the year, a 90-basis-point improvement compared to the prior year and a 10% improvement over the past six years. We achieved this by leveraging our investments in cutting-edge technology and workflow enhancements, and not by depriving our business of important investments. Improving operating leverage continues to be a priority for us. It gives us the flexibility to invest the gains in our strategic priorities or let the benefit fall to the bottom line.
Our cash flow from operations remained very strong at $6.5 billion in 2022. This primarily reflects the benefit of continued increases in premium volume and strong profitability. Our cash flow from operations has increased significantly over the last six years, with the average annual cash flow from operations for that period approximately 50% higher than the average for the prior years in the past decade. Strong cash flow enables us to make significant investments in our business, return excess capital to shareholders and grow our investment portfolio. Over that same six years, our investment portfolio, excluding unrealized investment gains (losses), grew by $17 billion, or 24%, to $86.7 billion at year-end.
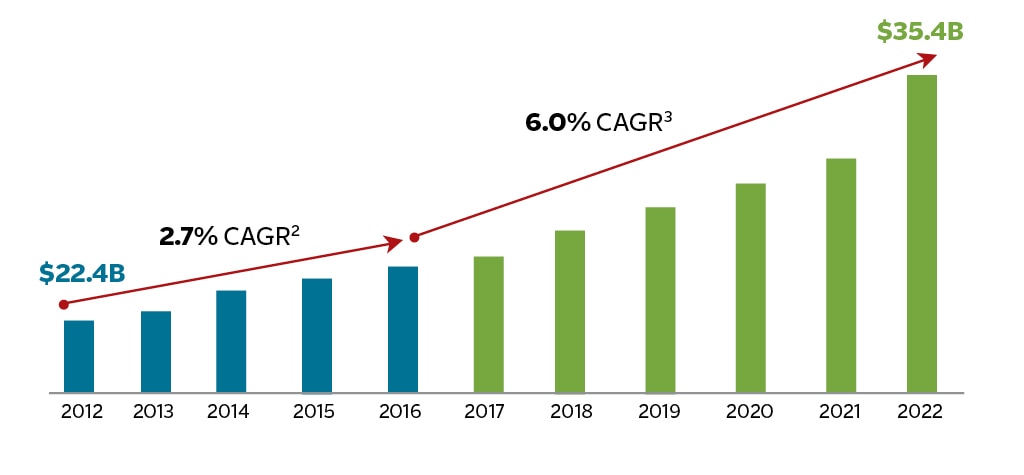
Turning to the top line, today’s production generates tomorrow’s earned premiums. In 2022, we delivered record net written premiums of $35.4 billion, up 11% compared to the prior year. This represents the 13th consecutive year of net written premium growth. All three of our business segments contributed meaningfully to this strong top-line performance, with Business Insurance up 10%, Bond & Specialty Insurance up 11% and Personal Insurance up 12%. This premium growth has been driven by high levels of retention, higher pricing and the addition of high-quality new business.
Investment Expertise
We strive to be thoughtful underwriters on both sides of our balance sheet, and we have always managed our investment portfolio to support our insurance operations, not the reverse. Accordingly, our investment portfolio is positioned to meet our obligations to policyholders under almost every foreseeable circumstance – anything from a global pandemic to a significant natural disaster to a financial crisis. With this in mind, we are focused on risk-adjusted returns and credit quality rather than reaching for yield that is not commensurate with the underlying risk. Our well-defined and consistent investment portfolio has been a meaningful and reliable contributor to our results year in and year out.
The performance of our investment portfolio in 2022 underscores the wisdom of our thoughtful and diversified approach. Net investment income was very strong at $2.2 billion after-tax, reflecting higher interest rates and the growth in our fixed income portfolio. While down year over year, as expected, our alternative portfolio continued to perform well, particularly in light of the significant downturn in the broader equity markets that occurred this year.
Looking forward, we expect to benefit in 2023 from higher invested assets in our fixed income portfolio and higher interest rates. As inflation has persisted and the Fed has aggressively shifted its policy in response, the yield on new investments is now meaningfully higher than the yield on our maturing investments. With rates possibly “higher for longer,” net investment income from our fixed income portfolio should continue to grow and meaningfully contribute to our results going forward.
Underwriting Expertise
Underwriting excellence is of course key to our success, and there is nothing more critical to underwriting excellence than a culture that values strong performance over time and understands how to balance the art and science of decision making based on data and analytics.
Culture alone is a significant competitive advantage, and one that we believe is very hard to replicate. A critical component of our culture is our granular approach to underwriting. In our commercial businesses, that means execution on an account-by-account or class-by-class basis. In personal lines, it means a very high degree of segmentation by risk profile, product and geography. With that and our advanced data and analytics, we thoughtfully select the risks we write and price our products deliberately with our target return in mind.
Like every aspect of our business, our focus on performance over time is core to how we manage our catastrophe exposure. Although we are unable to predict what the next event will be or where it will occur, we are taking steps every day to ensure that our portfolio of risk properly contemplates the potential for loss and that we maintain the right balance of risk and reward. While the impact of the risk-based decisions we are making today is not always evident immediately, they will continue to drive our performance over time.
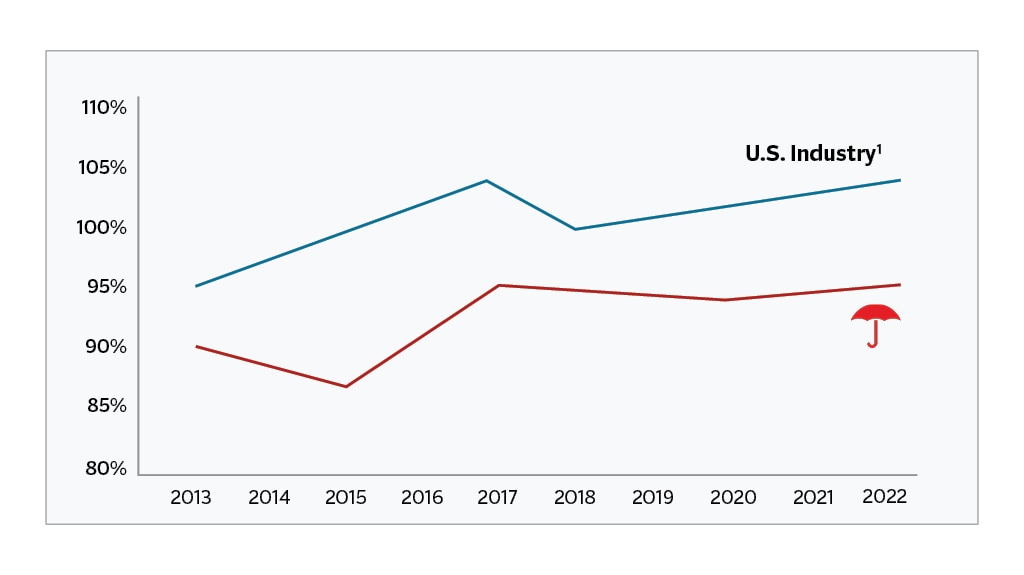
Over the past six years, our share of property catastrophe losses relative to total property catastrophe losses for the domestic P&C industry has declined significantly compared to the earlier years in the past decade. Our property catastrophe losses over the past six years have also been meaningfully lower than our corresponding market share.
As just one example, we continue to actively manage our coastal underwriting, including through thoughtful risk selection, higher-than-average coastal deductibles and flood sub-limits. These efforts have enabled us to manage our exposure to hurricanes more effectively, significantly benefiting our results over time and again this year. Our performance with respect to Hurricane Ian illustrates the benefits of our thoughtful approach. We estimate that, had we not taken the actions we did to manage our exposure in Florida, our losses from Hurricane Ian would have been nearly three times the amount we actually incurred. This is another good example of why we manage with a long-term focus – wise decisions often take time to show results.
Combined Ratio1 - Travelers in Comparison to the U.S. Industry
Combined_Ratio_Accordion
1Statutory Combined Ratio. Copyright © 2023, S&P Global Market Intelligence. Used with permission.
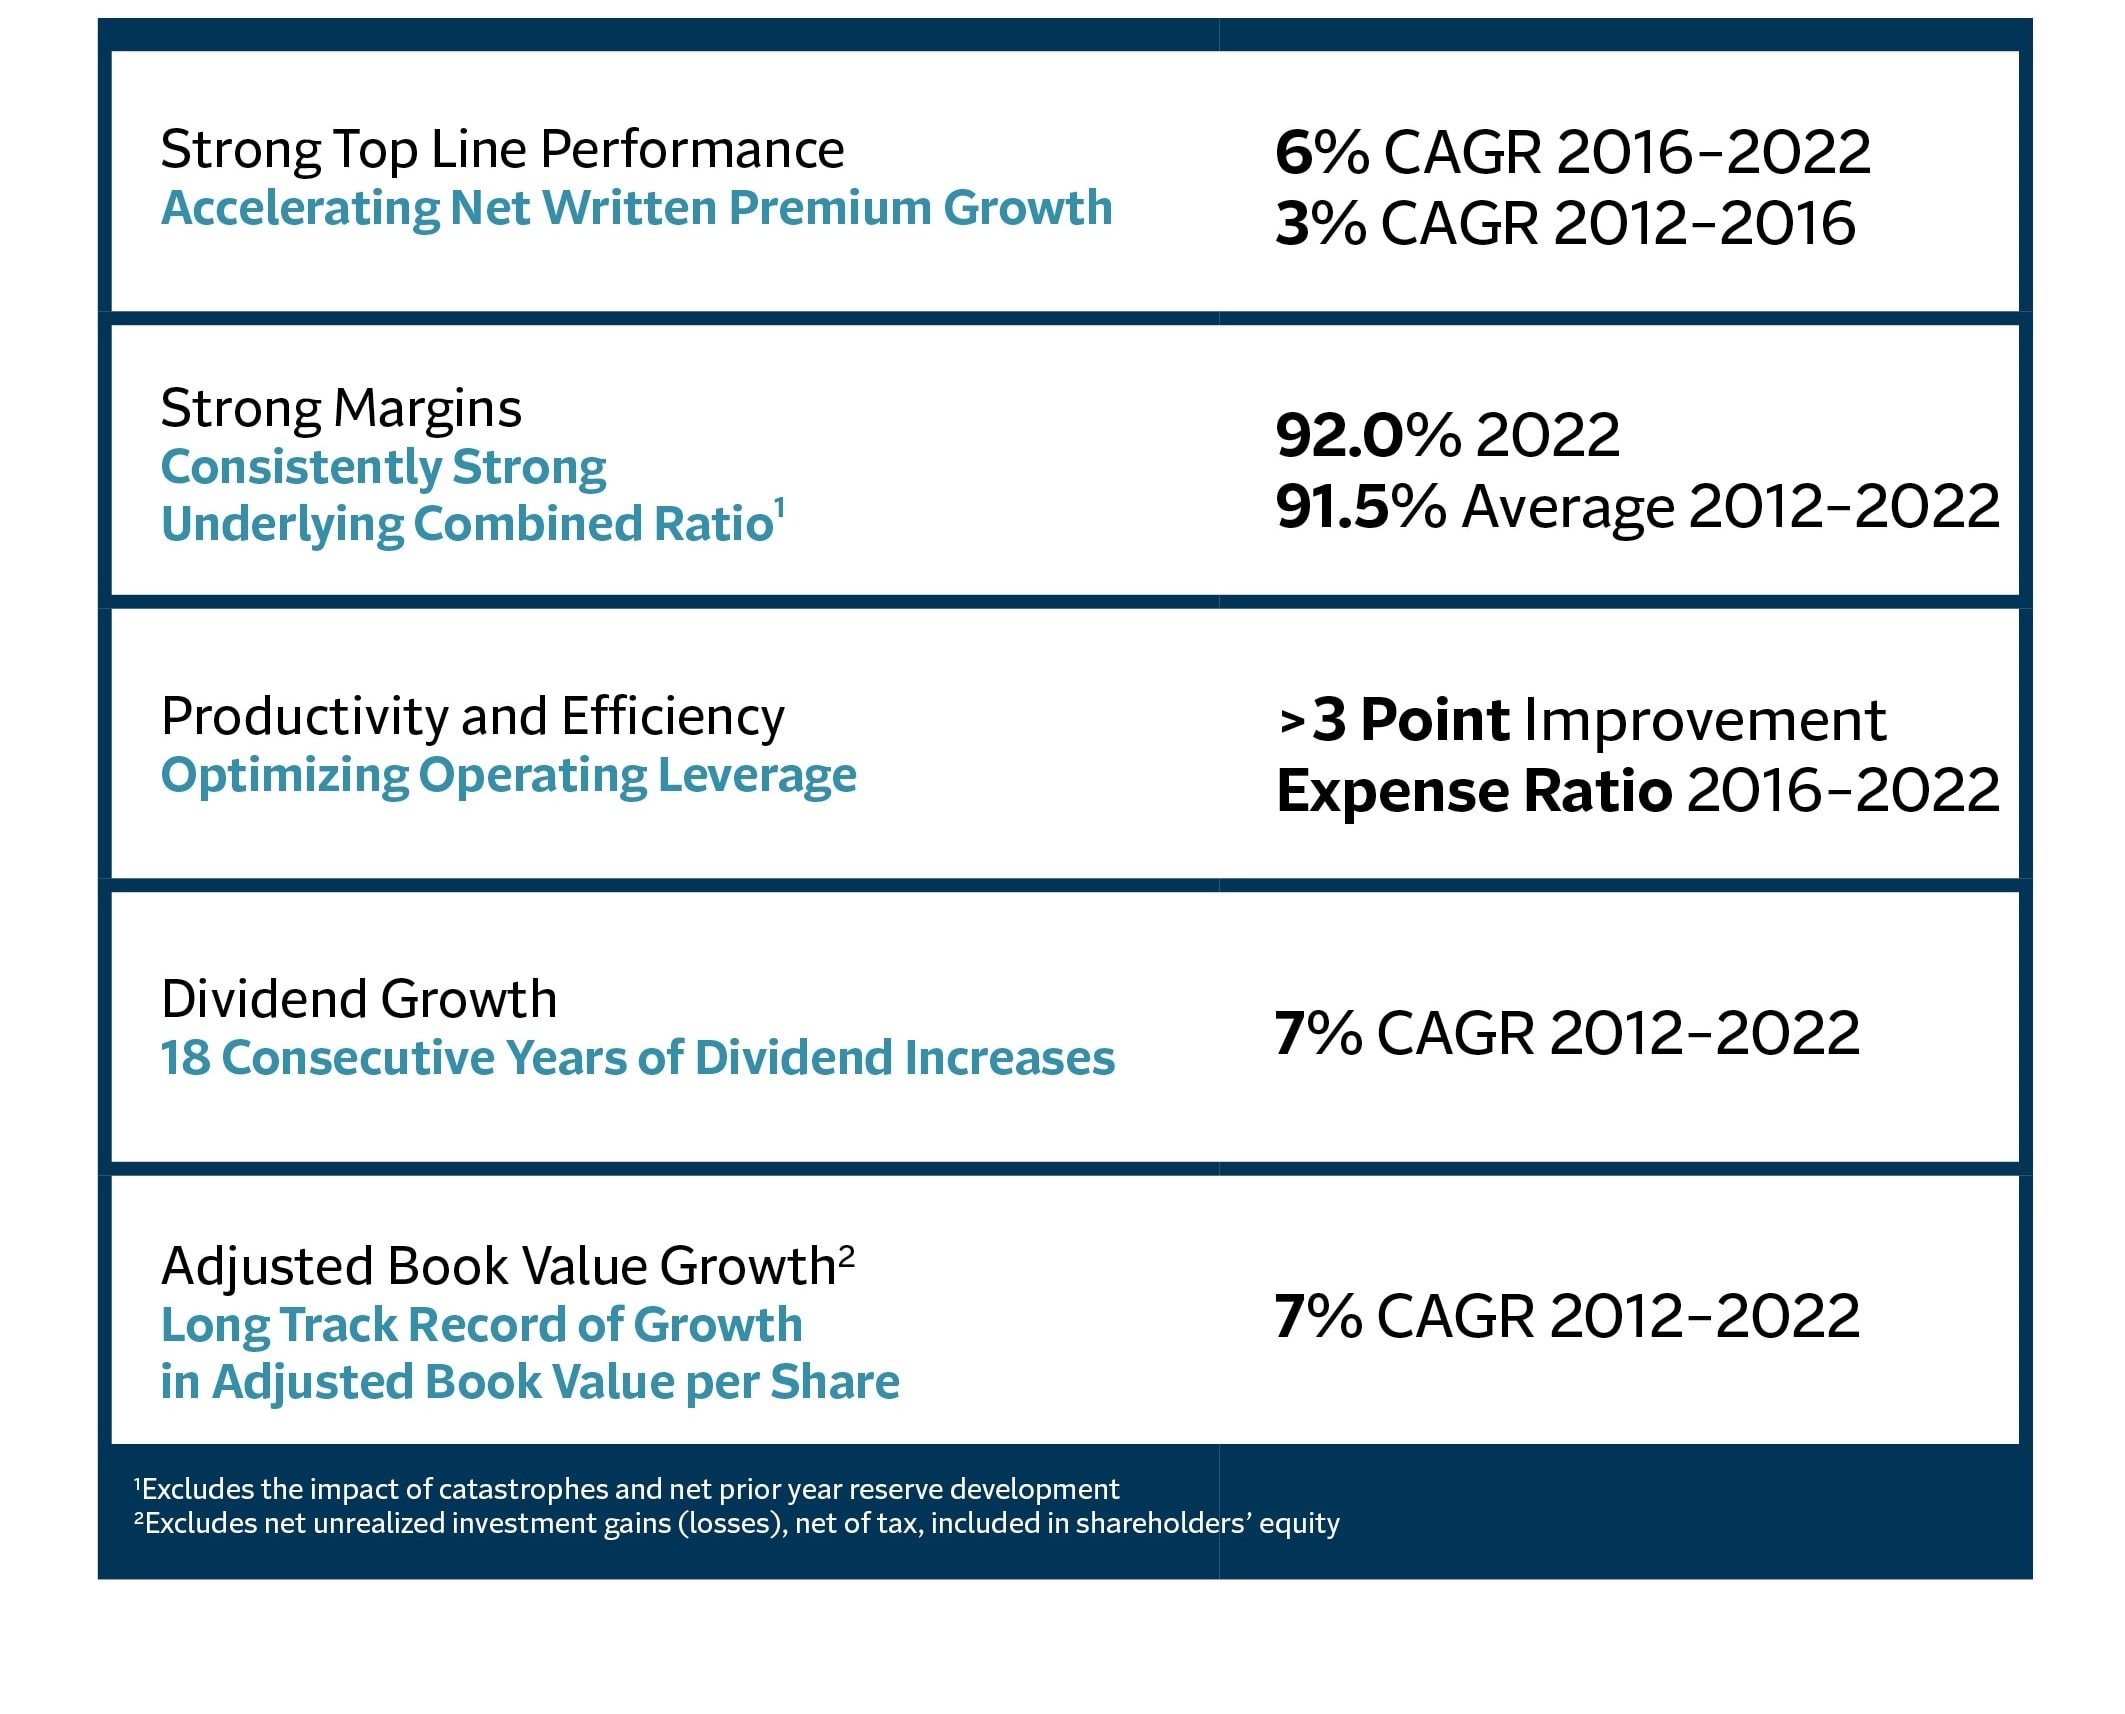
2022 Financial Results in the Context of Our Innovation Strategy
When we first articulated our innovation strategy several years ago, we made clear that it was designed in large part to position us to grow over time at leading returns. The charts below illustrate this strategy at work and its compounding, multiyear benefit. We have doubled our rate of growth, sustained strong underlying underwriting margins and lowered our expense ratio. That has resulted in higher underlying underwriting income, stronger cash flows and higher levels of invested assets.
We have not grown by underpricing the product or by changing our risk profile. We have grown by investing in franchise value and through great execution by our colleagues in the field. Importantly, the business that we are putting on the books is coming from products, geographies, classes of business and distribution partners that we know well, which gives us great confidence in the quality of the business we are writing.
Accelerating Net Written Premium Growth2,3
Net_Premium_Growth
2Represents growth from 2012 through 2016.
3Represents growth from 2016 through 2022.
Consistently Strong Underlying Profitability4
Underlying_Combined_Ratio
4Underlying combined ratio, which excludes the impact of catastrophes and net prior year reserve development.
Improving Expense Ratio
Improving_Expense_Ratio
Higher Underlying Underwriting Income5 (after-tax)
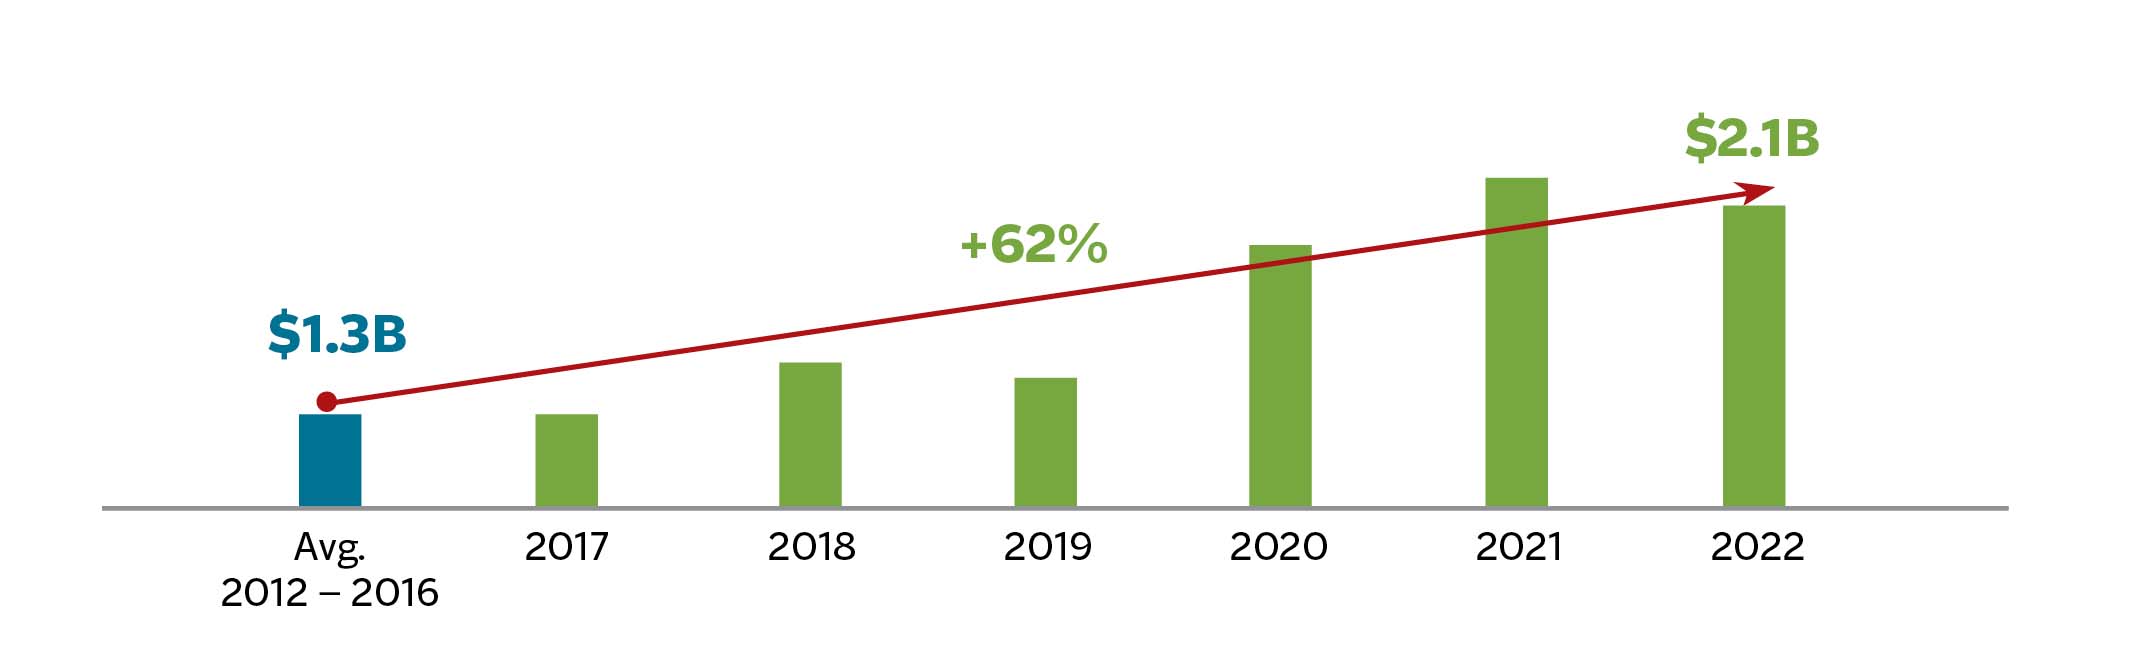
Underwriting Income
5Underlying underwriting income, which excludes the impact of net prior year reserve development and catastrophes.
Higher Cash Flow from Operations
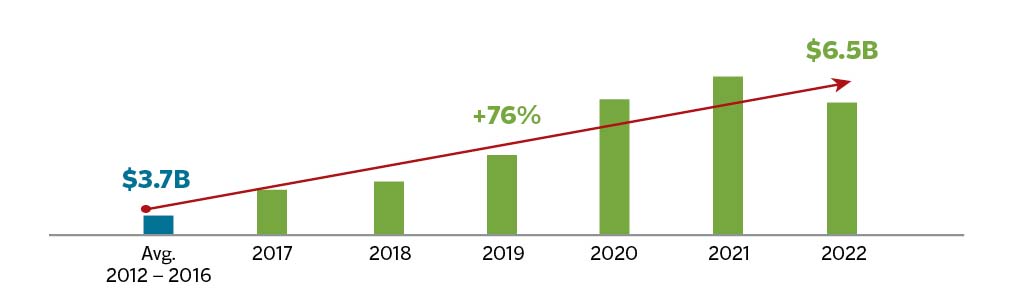
Higher_Cash_Flow
Growing Invested Assets6
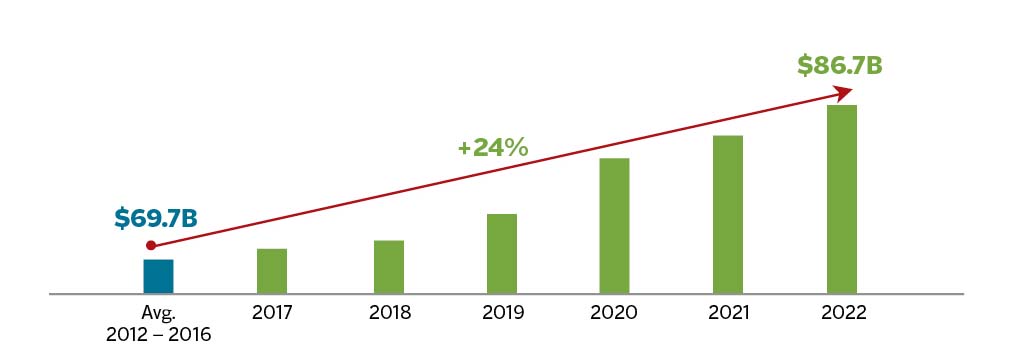
Growing_Invested_Assets
6Invested assets excludes net unrealized investment gains (losses).
Consistent and Successful Long-Term Financial Strategy Delivers Shareholder Value
It is important to consider our strategic initiatives and financial results in the context of what we are ultimately trying to achieve. At Travelers, our simple and unwavering mission for creating shareholder value is to:
- Deliver superior returns on equity by leveraging our competitive advantages;
- Generate earnings and capital substantially in excess of our growth needs; and
- Thoughtfully rightsize capital and grow book value per share over time.
The results we deliver are due to our deliberate and consistent approach to creating shareholder value. We have been clear for many years that one of our crucial responsibilities is to produce an appropriate return on equity for our shareholders. This has meant developing and executing financial and operational plans consistent with our goal of achieving superior returns, which we defined many years ago as a mid-teens core return on equity over time. We emphasize that this objective is measured over time because we recognize that the macroeconomic environment, loss cost trends, weather, and geopolitical and other factors impact our results from year to year, and that there will be years – or longer periods – and environments in which a mid-teens return is not attainable. In that regard, we established the mid-teens goal at a time when the 10-year Treasury was yielding around 5%, and mid-teens was simply the quantification of what qualified as an industry-leading return in that environment. While the 10-year Treasury rate increased during 2022, this increase will take time to earn into our fixed income portfolio, with less than 10% of the fixed income portfolio maturing each year. Our ability to achieve a mid-teens return over time going forward will depend, in part, on the interest rate environment. In any event, we always seek to deliver industry-leading returns over time.
Return on Equity7
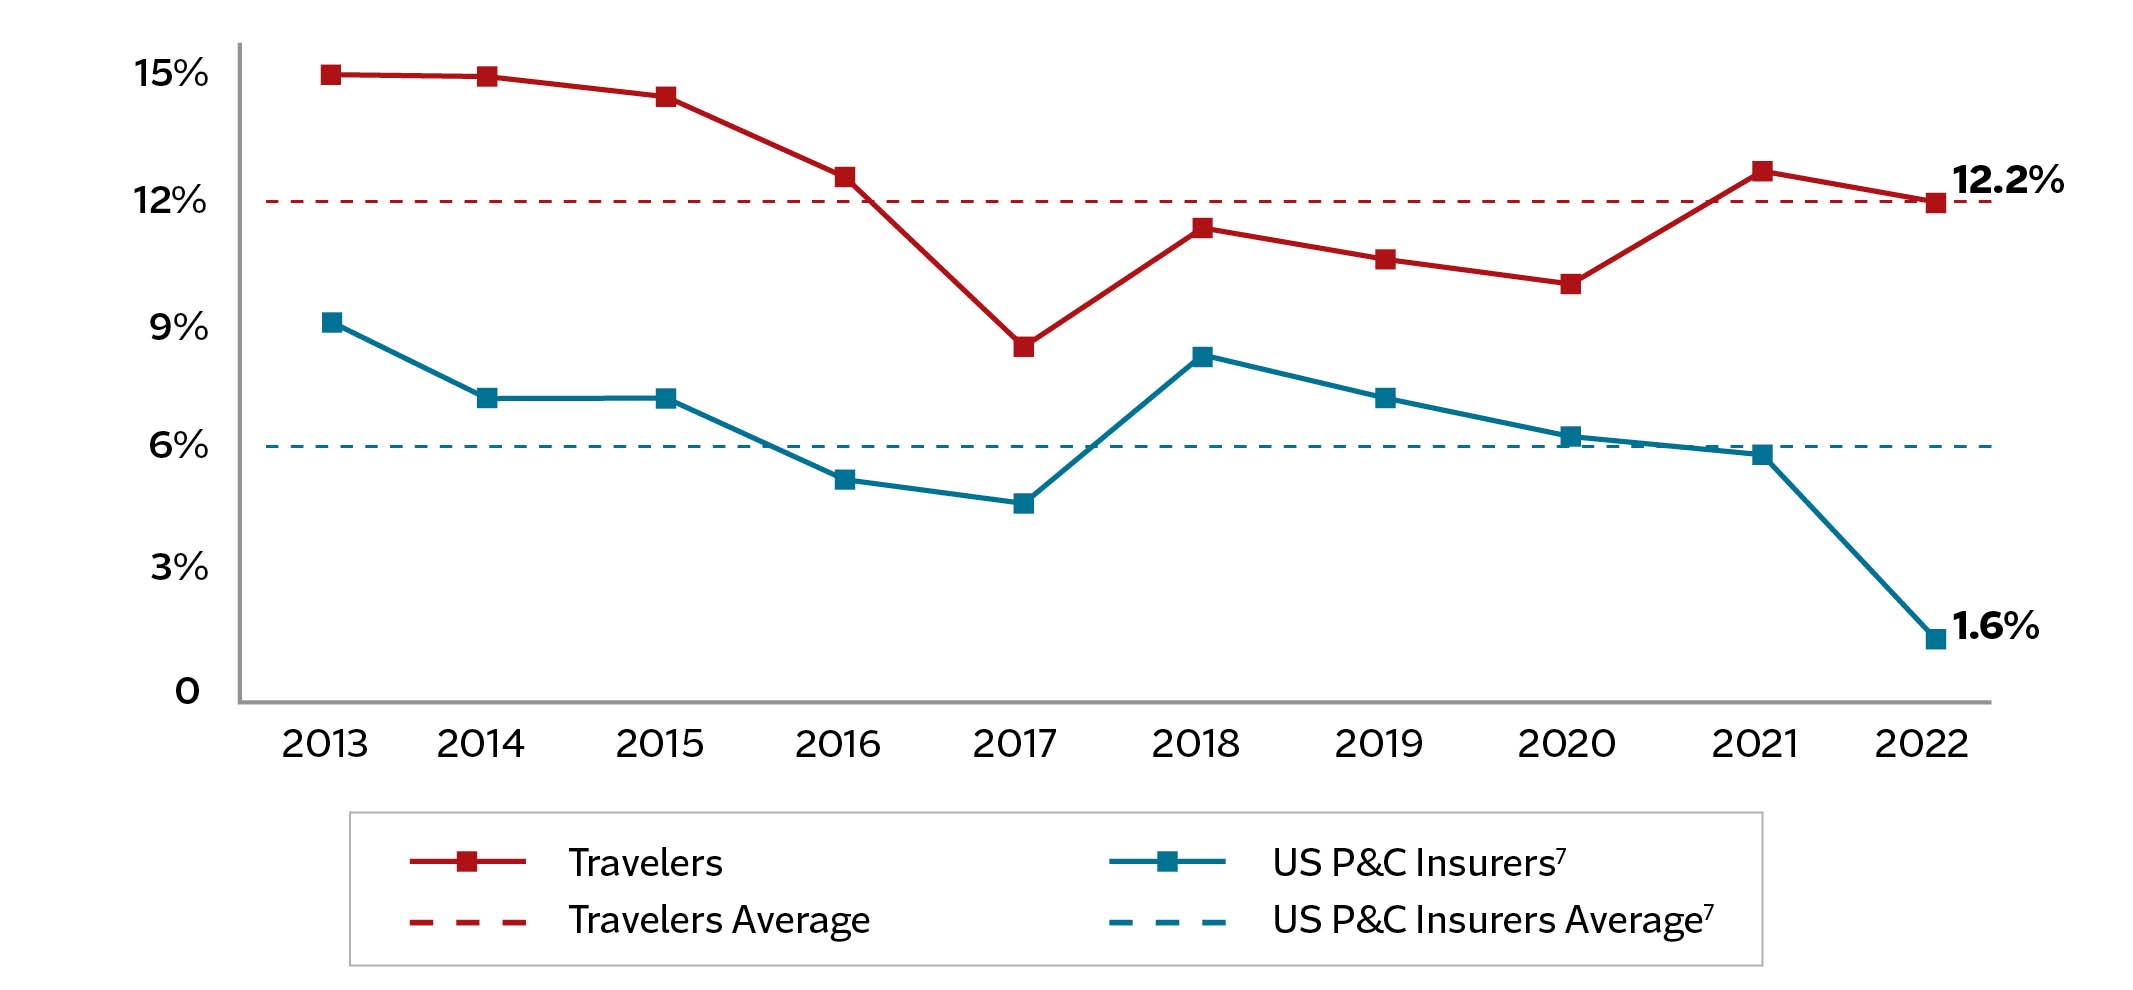
Return_On_Equity
72022 Forecast: ©2023 Conning, Inc., as published in Conning’s Property-Casualty Forecast & Analysis by Line of Insurance, 2022 Q4 edition. Used with permission. Historical data: © 2023 S&P Global Market Intelligence LLC. Used with permission.
Our 2022 return on equity of 12.2% and core return on equity of 11.3% again meaningfully exceeded the average return on equity for the domestic P&C industry of 1.6%, according to estimates from Conning, Inc., a global investment management firm and insurance research provider. As shown in the chart above, our return on equity has significantly outperformed the average return on equity for the industry in each of the past 10 years.
Importantly, these industry-leading returns on an absolute basis are even more impressive on a risk-adjusted basis when you take into account our industry-low volatility. The level and consistency of our return on equity over time reflect the value of our competitive advantages and the discipline with which we run our business.
A Balanced Approach to Rightsizing Capital
Our strong and consistent returns over time, together with our fortress balance sheet, have enabled us to grow both book value per share and adjusted book value per share at a compound annual growth rate of 3% and 6%, respectively, over the last 10 years.
Adjusted Book Value Per Share8
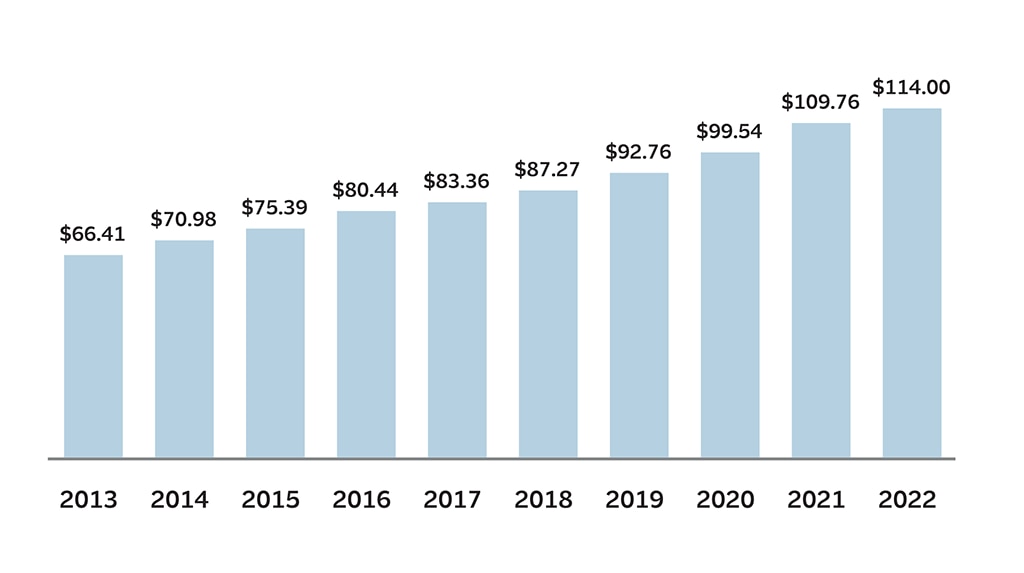
Adjusted_Book_Value
During this period, we have also returned a significant amount of excess capital to our shareholders through dividends and share repurchases. Over the last 10 years, we increased our dividend each year and grew dividends per share at an average annual rate of approximately 7%.
8Excludes net unrealized investment gains (losses), net of tax, included in shareholders’ equity.
Dividends Per Share
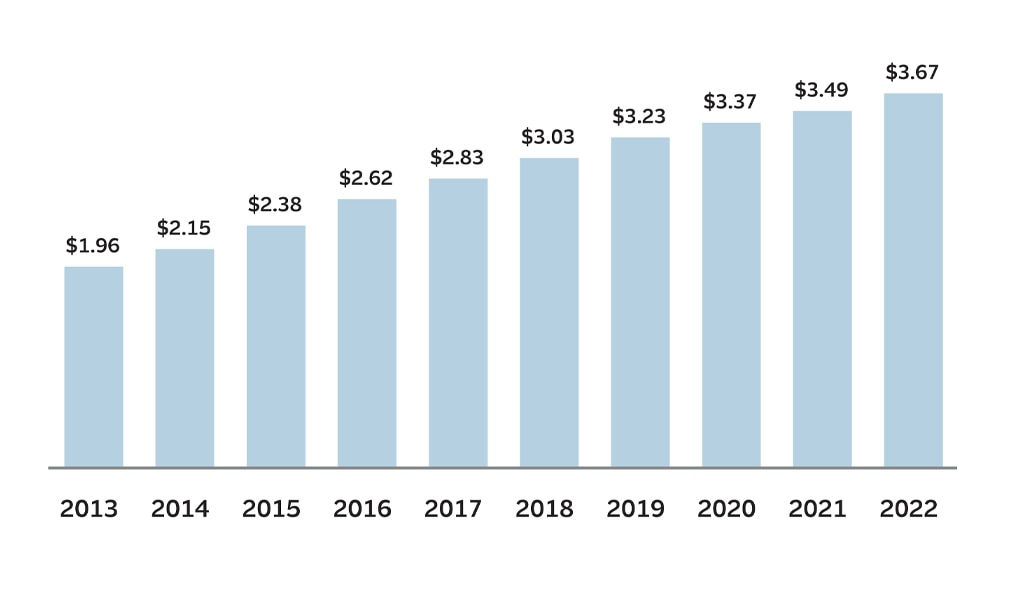
Dividends_Per_Share
Notably, since we began our share repurchase program in 2006, we have returned approximately $53 billion of excess capital to our shareholders, including through $40 billion of share repurchases – well in excess of the market capitalization of the company at that time.
Our capital management strategy has been an important driver of shareholder value creation over time. Our first objective for the capital we generate is to reinvest it in our business – organically and inorganically – to create shareholder value. For example, as we continue to grow our top line, as we have for the past few years, we will retain more capital to support that growth. Also, we continue to invest in everything from talent to technology to further our ambitious innovation agenda, advance our strategic objectives and enable tomorrow's performance.
Having said that, we are disciplined stewards of our shareholders’ capital. To the extent that we generate capital that we cannot reinvest consistent with our objective of generating industry-leading returns over time, we will manage it the same way we have for more than a decade – by returning it to our shareholders through dividends and share repurchases. By returning excess capital to our investors, we give them the ability to allocate their investment dollars as they see fit, including by investing in companies with different growth profiles or capital needs, thereby efficiently allocating capital across the economy. Over time, that efficient allocation of capital in the marketplace contributes to a stronger economy.
* See the Non-GAAP Reconciliations page for a discussion and calculation of non-GAAP financial measures.
Financial Highlights
At and for the year ended December 31. Dollar amounts in millions, except per share amounts.
|
2022 |
2021 |
2020 |
2019 |
2018 | |
|---|---|---|---|---|---|
|
Earned Premiums |
$33,763 |
$30,855 |
$29,044 |
$28,272 |
$27,059 |
|
Total Revenues |
$36,884 |
$34,816 |
$31,981 |
$31,581 |
$30,282 |
|
Core Income |
$2,998 |
$3,522 |
$2,686 |
$2,537 |
$2,430 |
|
Net Income |
$2,842 |
$3,662 |
$2,697 |
$2,622 |
$2,523 |
|
Net Income Per Diluted Share |
$11.77 |
$14.49 |
$10.52 |
$9.92 |
$9.28 |
|
Total Investments |
$80,454 |
$87,375 |
$84,423 |
$77,884 |
$72,278 |
|
Total Assets |
$115,717 |
$120,466 |
$116,764 |
$110,122 |
$104,233 |
|
Shareholders’ Equity |
$21,560 |
$28,887 |
$29,201 |
$25,943 |
$22,894 |
|
Return On Equity |
12.2% |
12.7% |
10.0% |
10.5% |
11.0% |
|
Core Return On Equity |
11.3% |
13.7% |
11.3% |
10.9% |
10.7% |
|
Book Value Per Share |
$92.90 |
$119.77 |
$115.68 |
$101.55 |
$86.84 |
|
Dividends Per Share |
$3.67 |
$3.49 |
$3.37 |
$3.23 |
$3.03 |
Deliberate and Disciplined Execution
Disciplined_Execution_Accordion
* See the Non-GAAP Reconciliations page for a discussion and calculation of non-GAAP financial measures.
Delivering Value Over Time
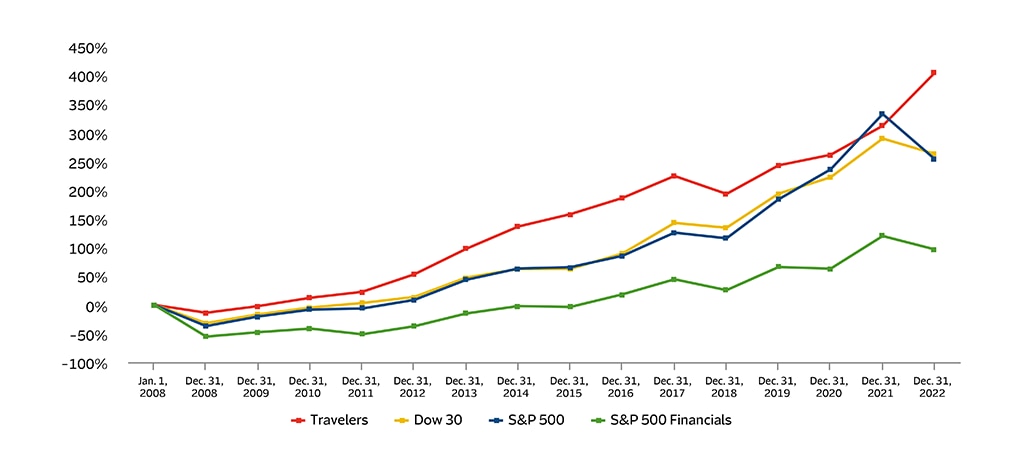
Ultimately, it is the success of our strategy – with all its component parts – that drives our total return to shareholders over time. It is important to remember that we have a well-established track record of managing the company to create value over the long term, through periods of weather volatility; through anticipated and unanticipated developments impacting loss trends; through both foreseeable and unforeseeable economic cycles; and through any number of more extreme economic, geopolitical and other conditions. With that in mind, the graph below compares our returns since the 2008 financial crisis to the returns for the Dow 30, the S&P 500 and the S&P 500 Financials.
Total Return to Shareholders1
Transcript_Accordion_Shareholder
1Represents the change in stock price plus the cumulative amount of dividends, assuming dividend reinvestment. For each year on the chart, total return is calculated with January 1, 2008, as the starting point and December 31 of the relevant year as the ending point. ©Bloomberg Finance L.P. Used with permission of Bloomberg.
Our stock performance reflects the execution of our long-term strategy. We provide our shareholders with industry-leading returns, low volatility and high credit quality. The success of this long-term strategy is evident in the strong performance of our stock over time, which has been remarkably consistent relative to many others in the P&C industry. Viewing our performance through this long-term lens, we are as confident as ever that executing on our long-term financial strategy, managing Travelers with an over-time discipline and continuing to invest in our competitive advantages through our ambitious and focused innovation agenda is the right approach for building on Travelers’ outstanding record.
Non-GAAP Reconciliations
Reconciliation of Net Income Per Share to Core Income Per Share on a Diluted Basis
For the year ended December 31,
| (Dollars in millions, after-tax) | 2022 |
2021 |
| Net Income | $11.77 | $14.49 |
| Adjustments: | ||
| Net realized investment (gains) losses, after-tax | 0.65 | (0.52) |
| Impact of changes in the tax laws and/or tax rates1 | — | (0.03) |
| Core Income | $12.42 | $13.94 |
Reconciliation of Shareholders' Equity to Adjusted Shareholders' Equity
As of December 31,
| (Dollars in millions) | 2022 | 2021 | 2020 | 2019 | 2018 | 2017 |
|---|---|---|---|---|---|---|
| Shareholders’ equity | $21,560 | $28,887 | $29,201 | $25,943 | $22,894 | $23,731 |
| Adjustments: | ||||||
| Net unrealized investment (gains) losses, net of tax, included in shareholders’ equity | 4,898 | (2,415) | (4,074) | (2,246) | 113 | (1,112) |
| Net realized investment (gains) losses, net of tax | 156 | (132) | (11) | (85) | (93) | (142) |
| Impact of changes in tax laws and/or tax rates1 | — | (8) | — | — | — | 287 |
| Adjusted shareholders’ equity | $26,614 | $26,332 | $25,116 | $23,612 | $22,914 | $22,764 |
Calculation of Return on Equity and Core Return on Equity
For the year ended December 31,
| (Dollars in millions, after tax) | 2022 | 2021 | 2020 | 2019 | 2018 |
|---|---|---|---|---|---|
| Net income | $2,842 | $3,662 | $2,697 | $2,622 | $2,523 |
| Average shareholders’ equity | $23,384 | $28,735 | $26,892 | $24,922 | $22,843 |
| Return on equity | 12.2% | 12.7% | 10.0% | 10.5% | 11.0% |
| Core income | $2,998 | $3,522 | $2,686 | $2,537 | $2,430 |
| Adjusted average shareholders’ equity | $26,558 | $25,718 | $23,790 | $23,335 | $22,814 |
| Core return on equity | 11.3% | 13.7% | 11.3% | 10.9% | 10.7% |
Calculation of Book Value Per Share and Adjusted Book Value Per Share
As of December 31,
| (Dollars in millions, except per share amounts) | 2022 | 2021 | 2020 | 2019 | 2018 | 2017 | 2016 | 2015 | 2014 | 2013 | 2012 |
|---|---|---|---|---|---|---|---|---|---|---|---|
| Shareholders’ equity | $21,560 | $28,887 | $29,201 | $25,943 | $22,894 | $23,731 | $23,221 | $23,598 | $24,836 | $24,796 | $25,405 |
| Less: Net unrealized investment gains (losses), net of tax, included in shareholders’ equity | (4,898) | 2,415 | 4,074 | 2,246 | (113) | 1,112 | 730 | 1,289 | 1,966 | 1,322 | 3,103 |
| Shareholders’ equity, excluding net unrealized investment gains (losses), net of tax, included in shareholders’ equity | $26,458 | $26,472 | $25,127 | $23,697 | $23,007 | $22,619 | $22,491 | $22,309 | $22,870 | $23,474 | $22,302 |
| Common shares outstanding | 232.1 | 241.2 | 252.4 | 255.5 | 263.6 | 271.4 | 279.6 | 295.9 | 322.2 | 353.5 | 377.4 |
| Book value per share | $92.90 | $119.77 | $115.68 | $101.55 | $86.84 | $87.46 | $83.05 | $79.75 | $77.08 | $70.15 | $67.31 |
| Adjusted book value per share | 114.00 | 109.76 | 99.54 | 92.76 | 87.27 | 83.36 | 80.44 | 75.39 | 70.98 | 66.41 | 59.09 |
Reconciliation of Net Income to Core Income, and Core Income to After-Tax Underlying Underwriting Income (Also Known as Underlying Underwriting Gain)
For the year ended December 31,
| (Dollars in millions, after-tax) | 2022 | 2021 | 2020 | 2019 | 2018 | 2017 | 2016 | 2015 | 2014 | 2013 | 2012 |
|---|---|---|---|---|---|---|---|---|---|---|---|
| Net income | $2,842 | $3,662 | $2,697 | $2,622 | $2,523 | $2,056 | $3,014 | $3,439 | $3,692 | $3,673 | $2,473 |
| Net realized investment (gains) losses | 156 | (132) | (11) | (85) | (93) | (142) | (47) | (2) | (51) | (106) | (32) |
| Impact of changes in tax laws and/or tax rates1,2 | — | (8) | — | — | — | 129 | — | — | — | — | — |
| Core income | 2,998 | 3,522 | 2,686 | 2,537 | 2,430 | 2,043 | 2,967 | 3,437 | 3,641 | 3,567 | 2,441 |
| Net investment income | (2,170) | (2,541) | (1,908) | (2,097) | (2,102) | (1,872) | (1,846) | (1,905) | (2,216) | (2,186) | (2,316) |
| Other (income) expense, including interest expense | 277 | 235 | 232 | 214 | 248 | 179 | 78 | 193 | 159 | 61 | 171 |
| Underwriting income | 1,105 | 1,216 | 1,010 | 654 | 576 | 350 | 1,199 | 1,725 | 1,584 | 1,442 | 296 |
| Impact of net (favorable) unfavorable prior year reserve development | (512) | (424) | (276) | 47 | (409) | (378) | (510) | (617) | (616) | (552) | (622) |
| Impact of catastrophes | 1,480 | 1,459 | 1,274 | 699 | 1,355 | 1,267 | 576 | 338 | 462 | 387 | 1,214 |
| Underlying underwriting income | $2,073 | $2,251 | $2,008 | $1,400 | $1,522 | $1,239 | $1,265 | $1,446 | $1,430 | $1,277 | $888 |
Reconciliation of Invested Assets to Invested Assets Excluding Net Unrealized Investment Gains (Losses)
As of December 31,
| (Dollars in millions) | 2022 | 2021 | 2020 | 2019 | 2018 | 2017 | 2016 | 2015 | 2014 | 2013 | 2012 |
|---|---|---|---|---|---|---|---|---|---|---|---|
| Invested assets | $80,454 | $87,375 | $84,423 | $77,884 | $72,278 | $72,502 | $70,488 | $70,470 | $73,261 | $73,160 | $73,838 |
| Less: Net unrealized investment gains (losses), pre-tax | (6,220) | 3,060 | 5,175 | 2,853 | (137) | 1,414 | 1,112 | 1,974 | 3,008 | 2,030 | 4,761 |
| Invested assets excluding net unrealized investment gains (losses) | $86,674 | $84,315 | $79,248 | $75,031 | $72,415 | $71,088 | $69,376 | $68,496 | $70,253 | $71,130 | $69,077 |
1Impact is recognized in the accounting period in which the change is enacted.
22017 reflects impact of Tax Cuts and Jobs Act of 2017 (TCJA).
Underlying underwriting income is net earned premiums and fee income less claims and claim adjustment expenses (excluding catastrophe losses and net prior year reserve development) and insurance-related expenses.
Average shareholders’ equity is (a) the sum of total shareholders’ equity at the beginning and end of each of the quarters for the period presented divided by (b) the number of quarters in the period presented times two.
Adjusted shareholders’ equity is shareholders’ equity excluding net unrealized investment gains (losses), net of tax, included in shareholders’ equity, net realized investment gains (losses), net of tax, for the period presented and the effect of a change in tax laws and tax rates at enactment (excluding the portion related to net unrealized investment gains (losses)). Adjusted average shareholders’ equity is (a) the sum of adjusted shareholders’ equity at the beginning and end of each of the quarters for the period presented divided by (b) the number of quarters in the period presented times two.
Return on equity is the ratio of (a) net income for the period presented to (b) average shareholders’ equity for the period presented. Core return on equity is the ratio of (a) core income for the period presented to (b) adjusted average shareholders’ equity for the period presented.
Definitions of certain terms on this site are included in the Glossary of Selected Insurance Terms portion of the Form 10-K.