Financial Performance: 2025 Results
Travelers delivered core income of $6.3 billion, or $27.59 of core income per diluted share, generating core return on equity of 19.4% – a meaningful spread over both the 10-year Treasury and our cost of equity. Very strong underlying underwriting income along with net favorable prior year reserve development and strong net investment income more than offset a record level of catastrophe losses, primarily from the California wildfires in the first quarter. These results were driven by the fundamental strength of our business and strong execution – not temporary tailwinds or favorable weather.
We delivered $5.5 billion of after-tax underlying underwriting income, an increase of more than 23% compared to last year’s then record performance. The strong result was driven by record net earned premiums and an underlying combined ratio that improved more than 200 basis points to 83.9%.
This year’s underlying underwriting results are even more impressive when considered in their historical context. As you can see in the chart below, we continue to take underlying underwriting income to an entirely new level.
Underlying underwriting income1 (in billions, after-tax)
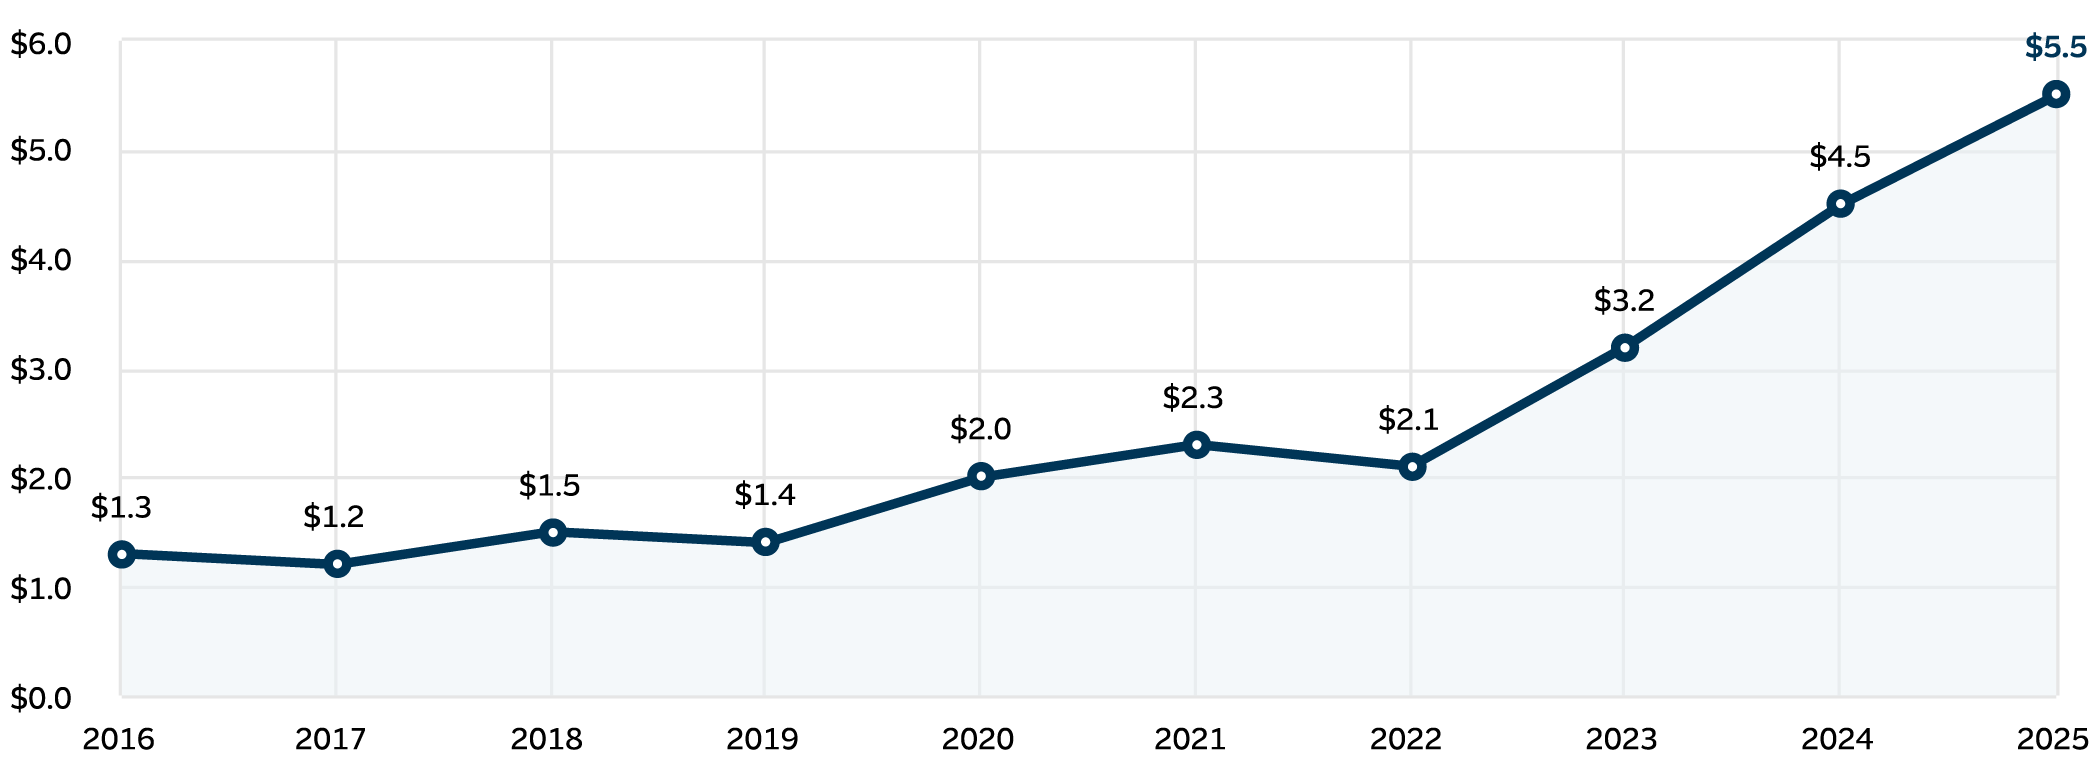
Line chart displaying Underlying Underwriting Income after-tax generally increasing from 2016 through 2025. In 2025, the underlying underwriting income was $5.5 billion, compared to $4.5 billion in 2024. This chart excludes the impact of net prior year reserve development and catastrophe losses.
1 Excludes the impact of net prior year reserve development and catastrophe losses.
The significant increase in underlying underwriting income we have delivered in recent years is an important and highly consequential result of the top-line growth and profitability we have achieved over the last 10 years. This higher level of underlying underwriting income has a degree of durability to it and positions us to deliver strong core income and returns even when losses from natural catastrophes reach unprecedented levels, as they did in 2025.
Turning to the top line, today’s production generates tomorrow’s earned premiums. Thanks to the strong franchise value that we have to offer and excellent marketplace execution by our field organization, in 2025 we grew net written premiums to a record $44.4 billion. Our value proposition has never been stronger.
Investment expertise
Our well-defined and consistent investment portfolio has been a meaningful and reliable contributor to our results, year in and year out. This is exactly what we saw in 2025. Net investment income increased by more than 10% to $3.3 billion after-tax.
Net investment income benefited from very strong top-line growth and record cash flow from operations, as well as higher long-term average yields. Notably, for the first time, total invested assets surpassed $100 billion.
Achieved a superior return on equity
Our 2025 return on equity of 21.0% and core return on equity of 19.4% meaningfully exceeded the average return on equity for the domestic P&C industry of 11.7%, according to estimates from Conning, Inc., a global investment management firm and insurance research provider. Our return on equity has significantly outperformed the average return on equity for the industry in each of the past 10 years, as shown in the chart below. Importantly, these industry-leading returns are even more impressive on a risk-adjusted basis taking into account the low level of volatility in our results. The level and consistency of our return on equity, particularly in the context of the growth we have achieved, reflect the value of our competitive advantages and the discipline with which we manage our business.
Return on equity
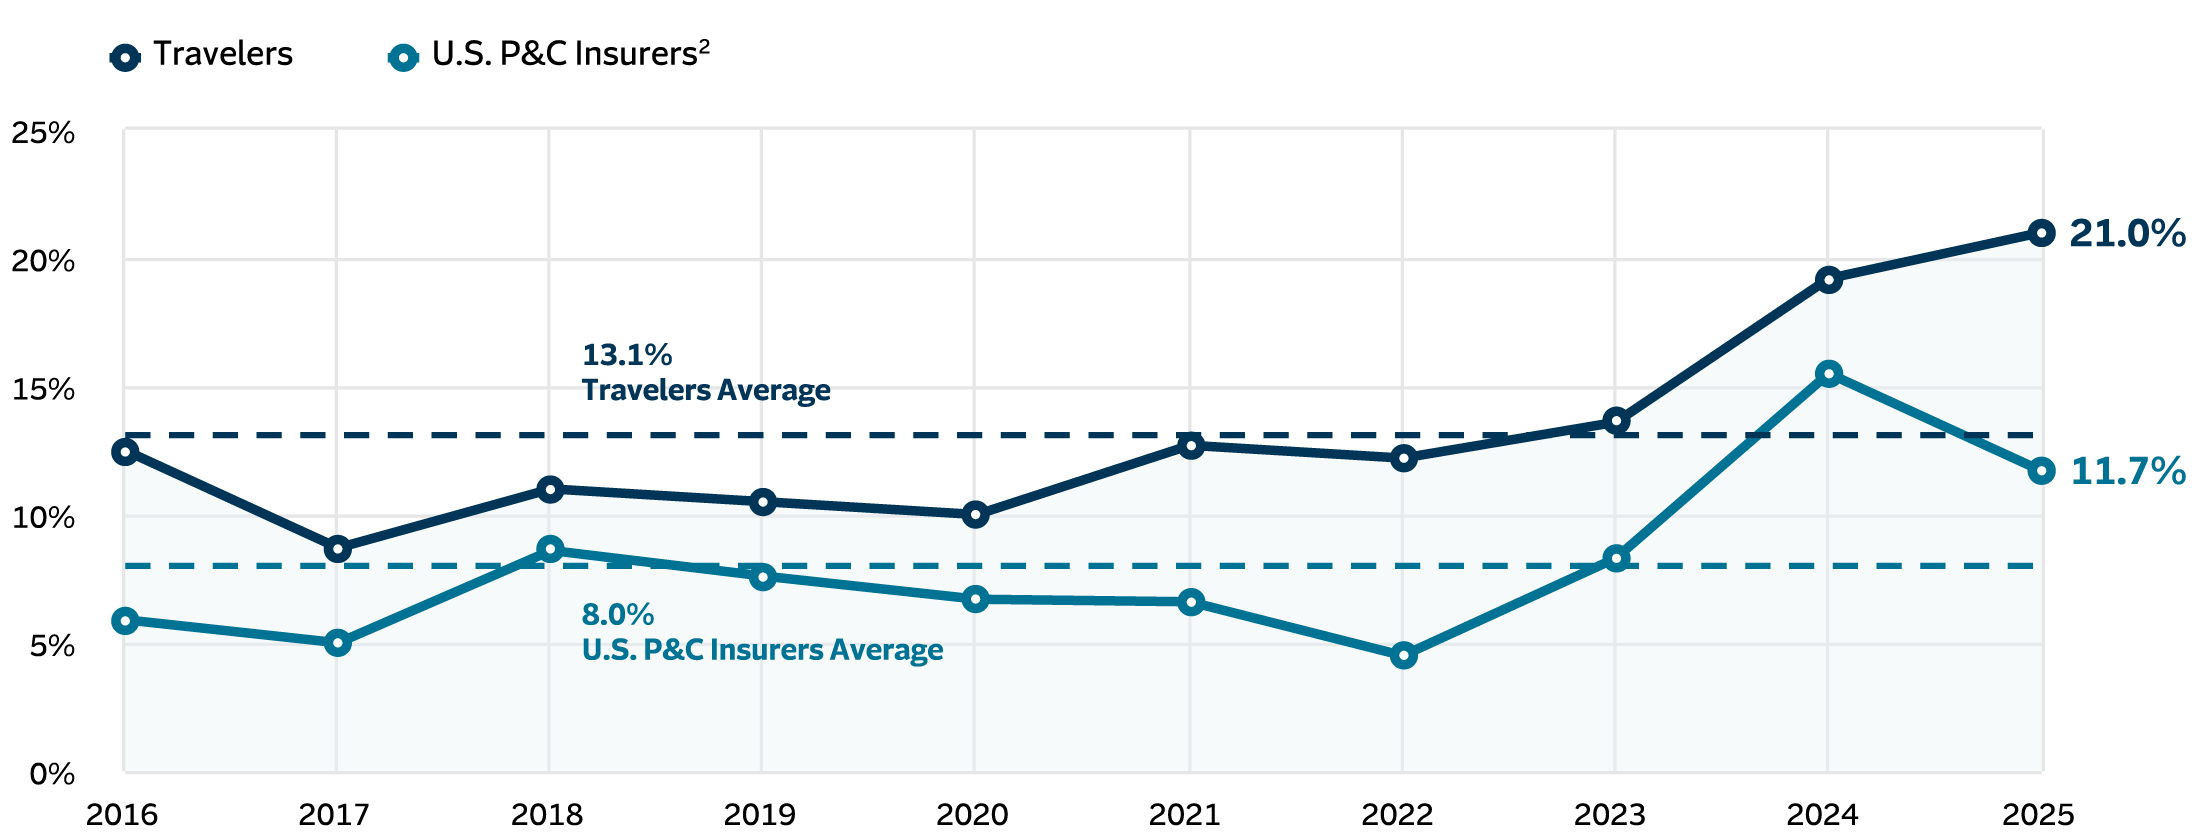
Line graph displaying Return on Equity for Travelers compared to U.S. P&C Insurers. Travelers is at 21.0% in 2025, compared to U.S. P&C Insurers at 11.7%. Travelers’ return on equity exceeds the average return on equity for the industry in each of the past 10 years. The 2025 Forecast is sourced from Conning, Inc., used with permission. S&P historical data used with permission.
2 2025 Forecast: © 2026 Conning, Inc., as published in Conning’s Property-Casualty Forecast & Analysis by Line of Insurance, 2025 Q4 edition. Used with permission. Historical data: © 2026 S&P Global Market Intelligence LLC. Used with permission.
A balanced approach to rightsizing capital
During 2025, our book value per share and adjusted book value per share increased by 23% and 14%, respectively, while, at the same time, we continued to make strategic investments in our business and to return a significant amount of excess capital to our shareholders through dividends and share repurchases.
Over the past decade, the compound annual growth rate of our book value per share was approximately 7% and the compound annual growth rate of our adjusted book value per share was 8%.
During 2025, we returned $4.2 billion in capital to shareholders through share repurchases of $3.2 billion and dividends of $1.0 billion.
Over the past decade, we have returned approximately $26 billion of excess capital to our shareholders, including through more than $17 billion of share repurchases. Just by virtue of our share repurchase program, for a shareholder who purchased Travelers stock a decade ago their percentage ownership has increased by approximately 36%.
Over the past decade, we have increased our dividend each year and increased dividends per share at an average annual rate of more than 6%.
Adjusted book value per share3

Bar chart displaying Adjusted Book Value per Share steadily increasing from 2016 through 2025. In 2025, the value was $158.01. This chart excludes net unrealized investment gains (losses), net of tax, included in shareholders’ equity.
3 Excludes net unrealized investment gains (losses), net of tax, included in shareholders’ equity.
Dividends per share

Bar chart displaying Dividends per Share steadily increasing each year from 2016 through 2025. In 2025, dividends per share were $4.35.
Cumulative share repurchases since 2006

Bar chart displaying Cumulative Share Repurchases since 2006 steadily increasing each year from 2016 through 2025. In 2025, cumulative share repurchases were $45.4 billion.
See the Non-GAAP Reconciliations section for a discussion and calculation of non-GAAP financial measures.
More about financial performance
Financial highlights
Review our financial highlights from recent years.
Delivering value over time
The success of our strategy – with all its component parts – drives our total return to shareholders over time.
Non-GAAP reconciliations
Review tables that provide reconciliations of certain GAAP financial measures to non-GAAP financial measures.